
The Service Overview provides a centralized interface displaying key information about your cluster.
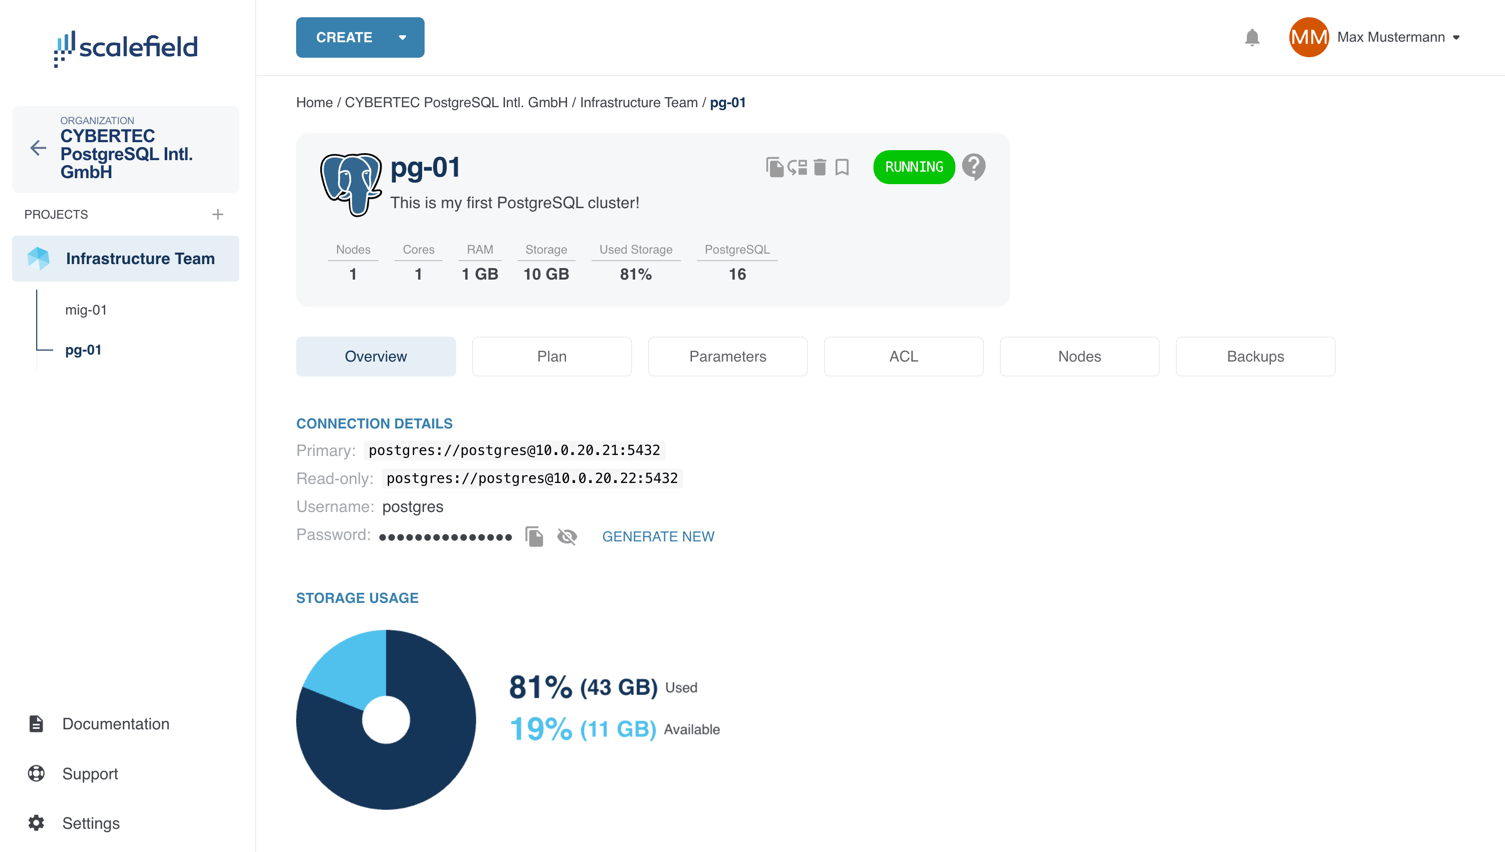
Within the Overview tab, you can:
- View and edit the cluster’s name and description.
- Monitor resource capacity and usage, including nodes, CPU cores, RAM, and storage.
- Check the current PostgreSQL version in use.
- Track the cluster’s status through a real-time status widget.
- Move the cluster to a different project, mark it as a favorite, or delete it.
- Access connection details for both primary and replica nodes, including:
- Username
- Host
- Port
- Password (with options to view, copy, or renew)
- View a graphical breakdown of storage capacity and current usage.
This tab serves as the central hub for reviewing and managing your service at a glance.